-

Map North
Education ResourceThis is a sub-tropical climate zone, with warm humid summers and mild winters. -
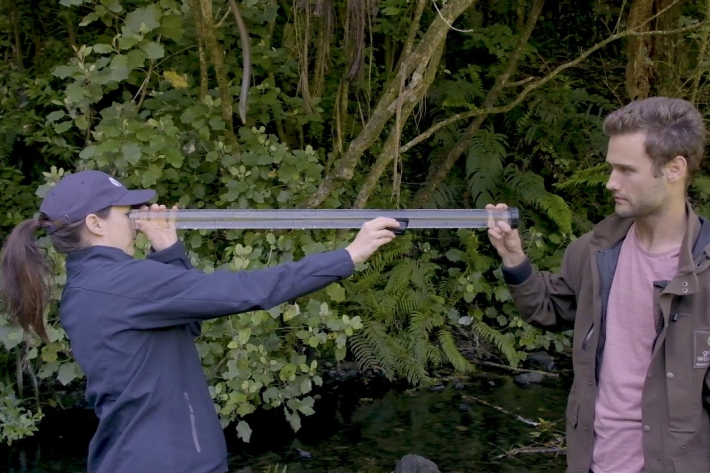
SHMAK water quality – visual clarity
There are two methods to determine visual clarity in SHMAK; the clarity tube (or SHMAK tube) and the black disc method. -

Urbanisation
Aotearoa’s main urban areas cover approximately 2% of total available land. -

Island Climate Update
Publication seriesA monthly summary of the climate in the tropical South Pacific islands, with an outlook for the coming months. -

SolarView help
This calculator estimates the solar energy that can be collected by a solar capture device (solar panel) at a given address, panel direction and roof slope. -

Clouds
Education ResourceCommon questions about clouds, how they are formed and how they behave. -
CASAL
CASAL is an advanced software package developed by NIWA for fish stock assessment. -

Chemical contamination and wastewater
What are the potential sources of chemical contaminants in wastewaters? -

Mining
Mining is the extraction of metal and mineral resources, such as gold, coal, petroleum, and ironsand


