-

Kiribati plans for climate change
-

Estuary origins
In comparison to the vast span of geological time, the estuaries that we see today are very recent coastal features. -

National and regional climate maps
Research ProjectMaps of average annual rainfall, temperature and other climate variables have been produced for all of New Zealand, based on the period 1981–2010. -

Tuna - spawning grounds
All species of freshwater tuna spawn at sea, although the spawning grounds of only four species are known with certainty worldwide. -

Educational Resources
Education ResourceProviding educational resources to school students and teachers is part of NIWA's commitment to helping young New Zealanders discover more about science and technology. -

Climate Change Vulnerability Assessment (CCVA)
ServiceTo prepare for changes in climate, our freshwater and oceans decision-makers need information on species vulnerability to climate change. -

Water dams
Damming water for urban use, hydro-electric power generation, irrigation, and other industrial and commercial uses. -

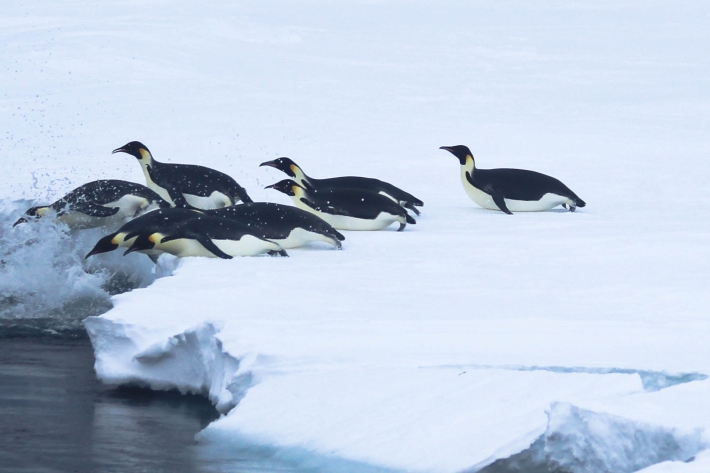
Emperor penguin foraging behaviour revealed
Media release06 June 2017An unavoidable delay in a research ship’s voyage to Antarctica resulted in some surprising and important findings about the behaviour of emperor penguins. -

Careers - FAQs
A list of some of the questions we get asked most frequently. If you don't see your question answered here, please get in touch. -

Farming and the primary sector
Farmers are making business decisions everyday which are influenced by environmental factors. We can help farmers to improve decision-making, mitigate farm environment risk, and to become more productive, efficient, competitive and sustainable.
