Drought forecasting dashboard
NIWA and MPI are working together to develop a new drought forecasting tool. It uses innovative climate modelling, the latest in machine learning and other data-driven techniques to predict rainfall 35 days ahead. It will help farmers and growers better prepare for periods of dryness and drought.
Climate and weather
-
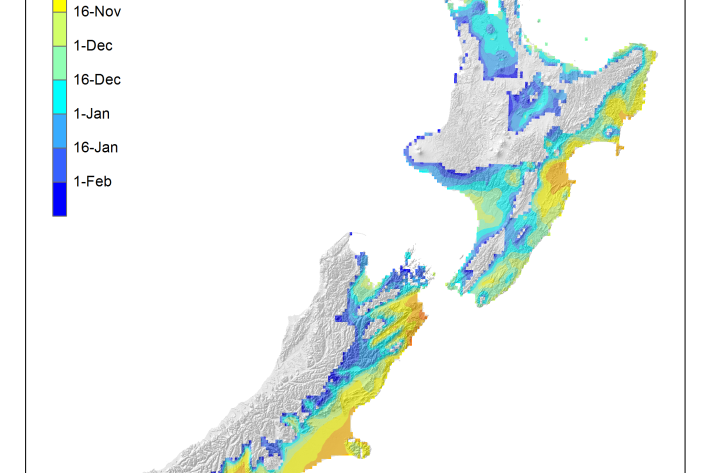
Average soil moisture deficit onset and termination maps
Maps of the average first and last dates of soil moisture deficit are shown here. -

Mean daily global radiation (Mj/sq m)
These datasets are available in a range of formats. -
Virtual Climate Station data and products
Virtual climate station estimates are produced every day, based on the spatial interpolation of actual data observations made at climate stations located around the country. -
Hotspot Watch Updates
This weekly update helps assess likelihood of extremely dry weather preceding a drought. Regions experiencing severely to extremely drier than normal soil conditions are deemed “hotspots” -
Map South
Education ResourceMost of this climate zone is characterised by cool coastal breezes, and absence of shelter from the unsettled weather that moves over the sea from the south and southwest. -

NZ temperature record
Research ProjectThere are many lines of evidence showing that NZ has warmed during the past century. -

Climate Change Vulnerability Assessment (CCVA)
ServiceTo prepare for changes in climate, our freshwater and oceans decision-makers need information on species vulnerability to climate change. -
HIRDSv4 Usage
NIWA's High Intensity Rainfall Design System (HIRDS) offers planners and engineers more certainty about the frequency of high-intensity rainfall events, enabling them to better design stormwater drainage, flood defence systems and other vital structures.