Data visualisation capability
- NIWA can create data visualisations that are tailored to meet your specific needs to help communicate forecasts.
- Animations can be used for operations or as outreach to external clients or the public.
Following are videos showing examples of the types of data visualisation we can create.
Forecast rainfall - 48 hour total:
Weekly wind and temperature:
Australian Smoke Forecast with biomass burning - aerosol optical depth:
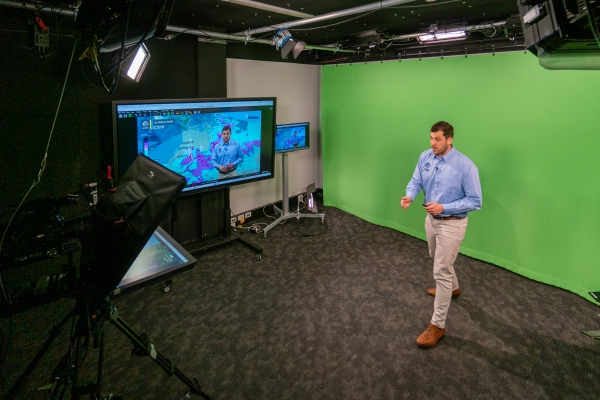
State-of-the-art studio
Our fully equipped digital media studio helps us communicate weather and climate information in innovative and compelling ways.
- We can provide videos of forecasts presented by a NIWA meteorologist to step you through what the weather may mean for your business or industry.
- Alternately forecast videos can be unhosted and automated.
- Videos can be automatically delivered to an SFTP or video hosting service such as YouTube or Vimeo.


