Weekly update to help media assess likelihood of extremely dry weather preceding a drought. Regions experiencing severely to extremely drier than normal soils conditions are deemed “hotspots”.
Facts: Soil Moisture
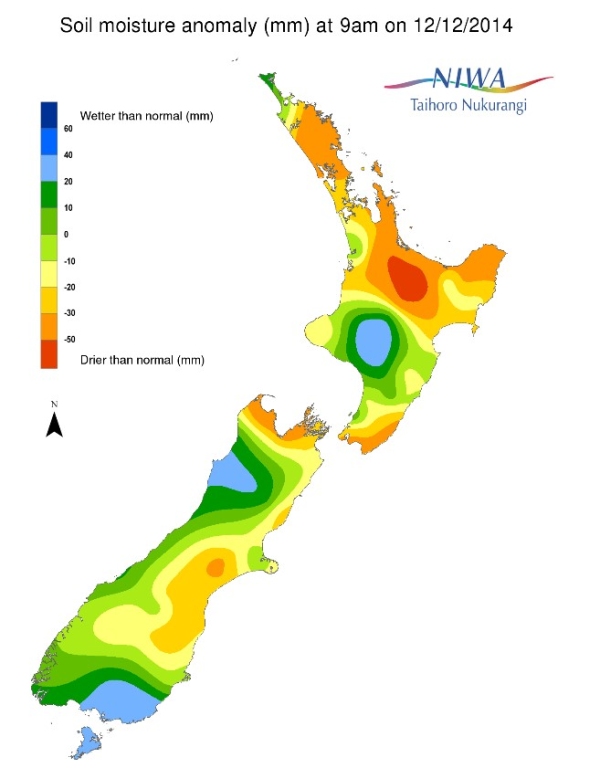
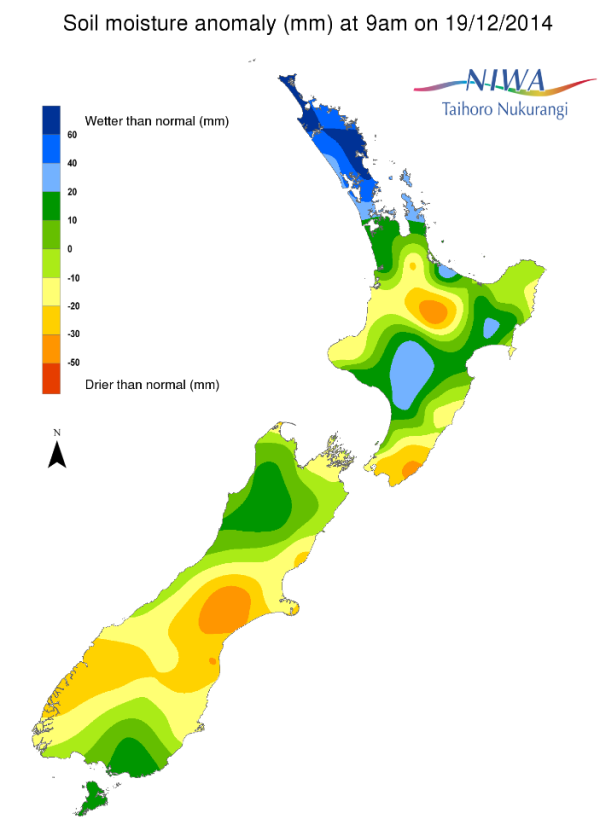
For the North Island, soils continue to be much drier than normal (refer to figure below) for this time of year for central and southeastern parts of the island. More specifically, the central and eastern Waikato along with far western parts of the Bay of Plenty region are currently experiencing severely dry soils for this time of year. Farther south, from Wellington to eastern Wairarapa, severely dry soils for this time of year are evident along with pockets of extremely dry soils over South Wairarapa. Drier than normal soils for this time of year are also present over a small areas of eastern Taranaki. Conversely, wetter or much wetter than normal soils for this time of year now exist for all of the Auckland and Northland regions as well as for central and west portions of the Manawatu-Wanganui region.
For the South Island, soil moisture levels also continue to be much drier than normal for east-central parts of the island. For the northern part of the island, this includes the northern coasts of Tasman, Nelson and Marlborough where severely to extremely dry soils for this time of year exist. Farther south, soils are drier than normal for this time of year from coastal Fiordland through interior Otago northeast through northern coastal Canterbury. With pockets of severely to extremely dry soils for this time of year also evident in this region.
Week-to-Week Comparison
When compared to this time last week, it is distinctly evident that soil moisture dramatically improved (increased) over nearly all of the North Island. In fact, Northland and parts of Auckland both experienced a remarkable turnaround going from severely dry soil moisture deficits to now abnormally wet soil moisture levels for this time of year. Soil moisture levels, while still severely low, improved noticeably over the central and especially eastern parts of the island. Perhaps the only area that experienced little or no soil moisture improvement was the South Wairarapa region were severely to extremely dry soils remain.
Soil moisture levels in the South Island improved significantly over the northern part of the island. However, in south-central Canterbury, there has been an expansion of severely drier than normal soils for this time of year as well as a newly develop region of drier than normal soils over Fiordland and inter Otago.
Commentary
When considering the current soil moisture anomalies for this time of year, hotspots exist in much of central and southern Canterbury as well as far northern Otago – slight worsening since last week.
In the Wellington Region, South Wairarapa and Wellington City, while having improved, are additional hotspot areas, especially east of Wellington City. Farther north, central and eastern Waikato are hotspot areas, in spite of improved soil moisture levels.
For hotspot regions, sustained rainfall over several weeks is needed to return conditions back to normal. Additionally, if current conditions persisted, then drought conditions may be imminent.
Background:
Hotspot Watch a weekly advisory service for New Zealand media. It provides soil moisture and precipitation measurements around the country to help assess whether extremely dry conditions are imminent.
Soil moisture deficit: the amount of water needed to bring the soil moisture content back to field capacity, which is the maximum amount of water the soil can hold.
Soil moisture anomaly: the difference between the historical normal soil moisture deficit (or surplus) for a given time of year and actual soil moisture deficits.
Definitions: “Extremely” and “severely” dry soils are based on a combination of the current soil moisture status and the difference from normal soil moisture (see soil moisture maps at https://www.niwa.co.nz/climate/nz-drought-monitor/)
Pictured below: Soil Moisture Anomaly Maps, relative to this time of year. On the left are values this time last week. On the right are the most recent values.


